Cotality’s new figures show tight listings, firm rents and uneven value growth across the capital cities and regions
A growing mismatch between housing supply and demand has helped drive sharply different property value outcomes across Australia since early 2020, according to new analysis from Cotality.
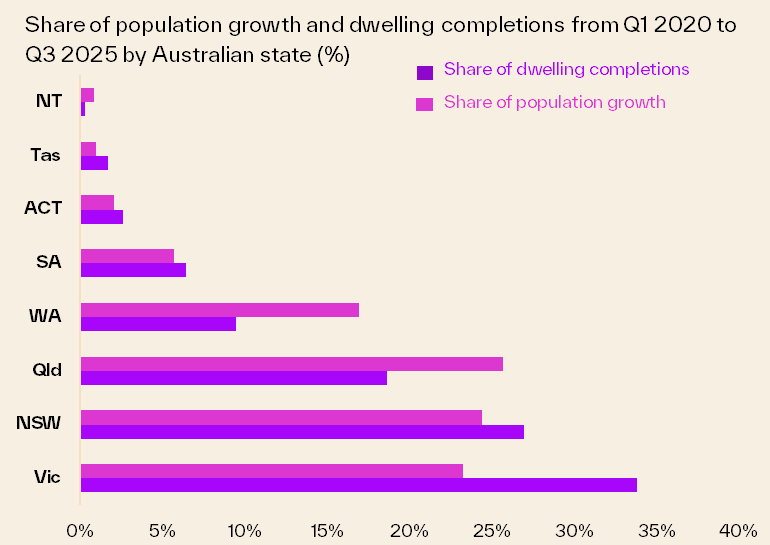
The research, published in Cotality’s April Housing Chart Pack, found the strongest gains in dwelling values between Q1 2020 and Q3 2025 were concentrated in states where dwelling completions did not keep pace with population growth.
Western Australia and Queensland best illustrated the supply-demand imbalance identified in the data.
 Source: Cotality
 “In WA and QLD, the share of dwelling completions fell well behind the share of population growth, with these states seeing home values more than double since 2020,” said Gerard Burg (pictured right), head of research at Cotality Australia.
“QLD accounted for over 25% of the total increase in Australia's population over this period, but less than 20% of the dwellings completed were located in QLD.
“In WA, across the same period, the share of the country’s population growth was nearly 17%, in contrast just 10% of completed dwellings.”
Burg also pointed to Queensland’s outsized population gains over the period, including movement linked to lifestyle and affordability factors.
“QLD has long attracted retirees from other states, and, until recently, offered buyers some more affordable markets compared with other major cities,” Burg said. “Net migration to QLD has started to slow in the last few quarters, and first-home buyers may increasingly look to opportunities elsewhere.”
At the other end of the scale, Victoria recorded the largest share of completions—around one-third of the national total—outstripping its share of population growth.
“Policy support at both the state and federal level assisted the growth in VIC dwellings over this period,” Burg said. “Almost 63% of this new supply in VIC were stand-alone houses, which we see Australians still have a revealed preference for. In NSW, for example, the split between houses and units was closer to 50-50.”
South Australia was identified as an exception: home values rose by more than 90% over the five-year period despite completions broadly tracking population growth.
“Overall, when we see a supply-demand imbalance such as those in Perth or Brisbane, we wind up with a large pool of buyers competing for a small pool of dwellings,” Burg noted. “This creates a seller’s market and can rapidly drive up home values, as we saw in these two capitals.”
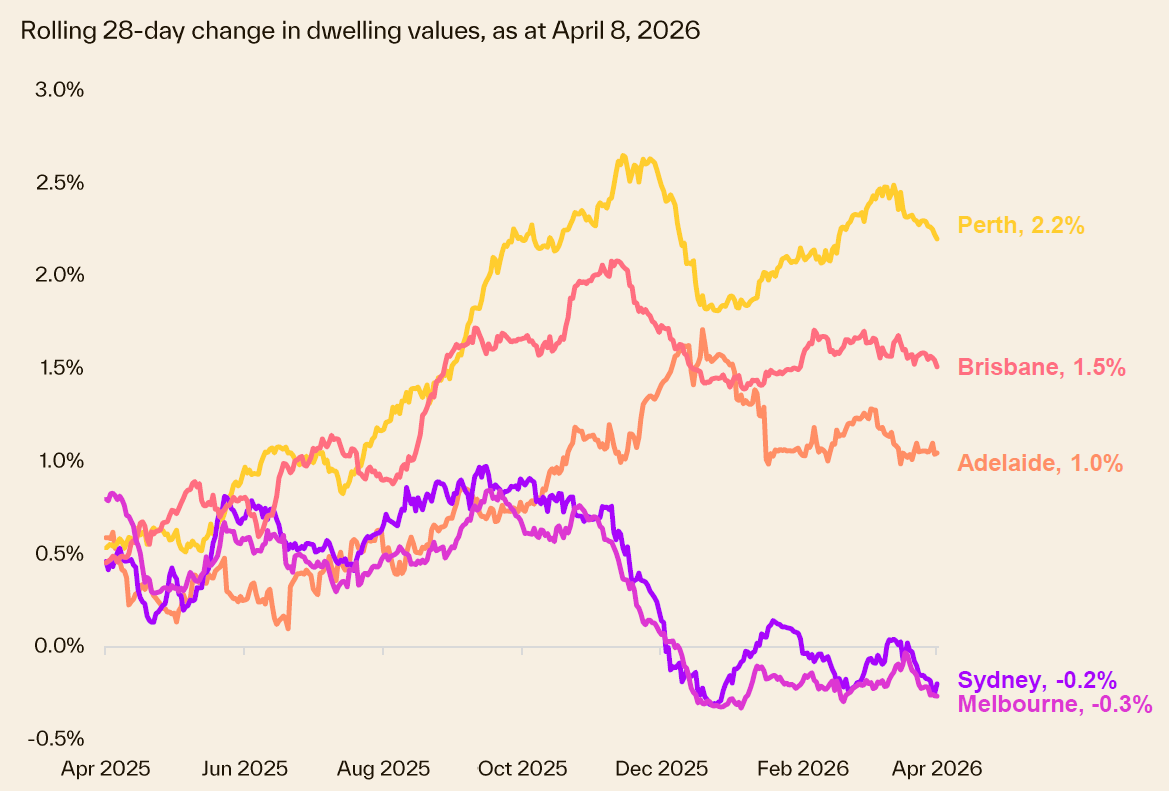
Australia’s total residential property market value reached $12.6 trillion in March, Cotality also reported. National dwelling values rose 2.1% over the quarter and were up 9.9% over the year to March, the fastest annual rate since June 2022.
The study also pointed to a split between markets. Cotality said the rolling four-week change has weakened further in Sydney and Melbourne, while momentum in several mid-sized capitals has moderated. Regional markets, by contrast, have held up better, which the firm attributed to regional migration patterns and affordability.
 Source: Cotality
Transaction volumes were estimated at nearly 559,457 sales in 2026 to date, 1.9% lower than a year earlier but 5.6% above the five-year average. Median time on market was 30 days nationally, down from 33 days in Q1 2025, with capital city properties selling fastest in Perth (nine days) and slowest in Darwin (47 days) and Canberra (43 days).
Vendor activity was described as below typical levels for this point in the year. Cotality recorded 36,712 new listings in the four weeks to 5 April 2026, down 3.3% compared with March last year. Most capitals recorded fewer new listings than a year ago, with Brisbane (up 3.3%) and Hobart (up 9.1%) the exceptions.
Rental conditions remained tight. The vacancy rate was 1.6% in March, and gross rental yields nationally rose to 3.57%. Darwin again recorded the highest gross yield at 6%, while Sydney posted the lowest at 3.1%.
Want to be regularly updated with mortgage news and features? Get exclusive interviews, breaking news, and industry events in your inbox – subscribe to our FREE daily newsletter. You can also follow us on Facebook, X (formerly Twitter), and LinkedIn.