Market activity cools as energy price concerns feed into rate outlook
UK house prices fell by 0.5% in March after a 0.3% rise in February, according to the latest Halifax House Price Index.
The lender said the average property price is now £299,677.
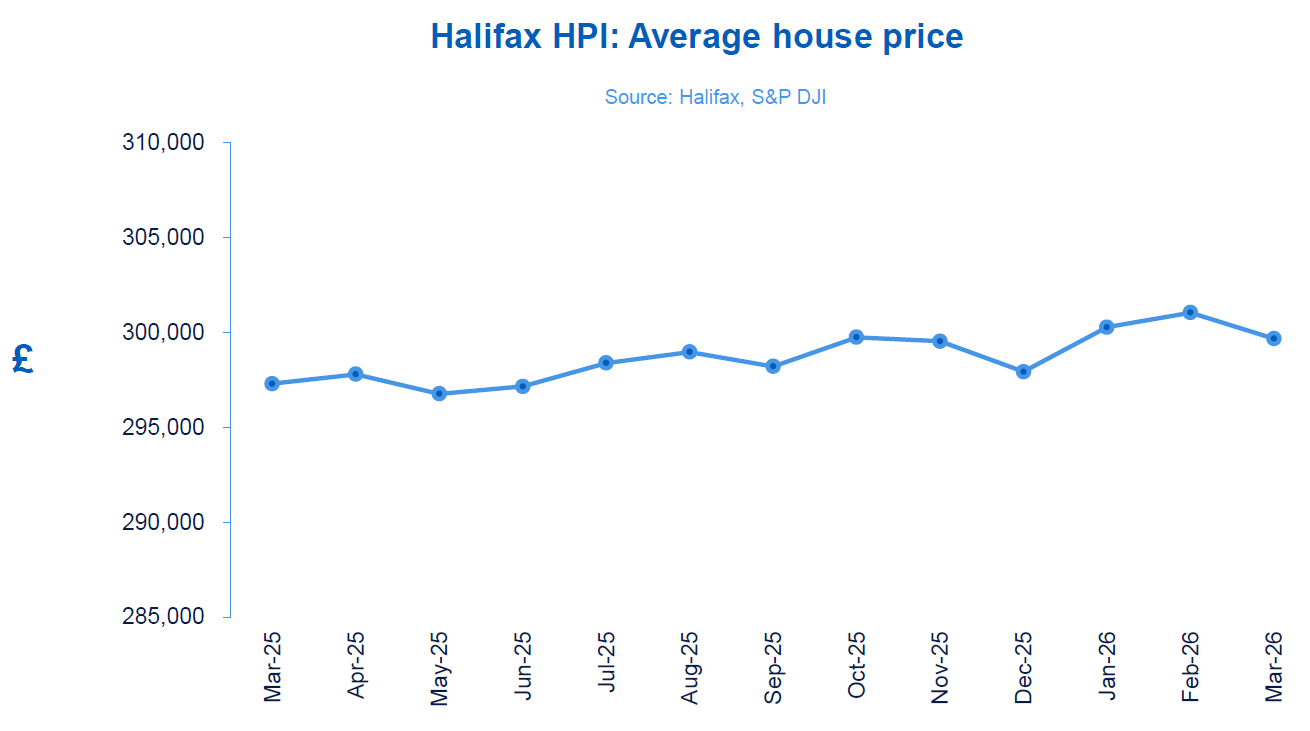
Annual house price growth slowed to 0.8% in March from 1.2% in February, indicating softer momentum at the start of the spring market.
 “The recent slowdown in the housing market reflects the wide uncertainty regarding the conflict in the Middle East,” said Amanda Bryden (pictured right), head of mortgages at Halifax. “Concerns about higher energy prices have pushed up inflation expectations, which in turn led to a rise in mortgage rates, reducing confidence that interest rates will be cut this year and dampening the initial momentum in the market seen at the start of the year.
“The effect on house prices will largely depend on how long‑lasting these pressures prove to be and the wider implications for the economy and unemployment. Mortgage rates are a key factor for buyers, particularly those getting on the ladder for the first time, who are already balancing the challenge of saving a deposit, with the cost of borrowing. As a result, many are likely to watch movements in mortgage rates closely, before making a decision on any home purchase. In this environment, professional advice can play an important role in helping people understand their options and make informed decisions that are right for their individual circumstances.
“However, the recent increase in UK mortgage rates has been more modest than the sharp rises seen during the mini budget of 2022. Further, many households will already be on fixed deals, protecting them from the latest rate rises. Taking all this into account, house prices may prove resilient, even if uncertainty weighs on market activity in the near term.”
| Regional: All Houses, All Buyers (Seasonally Adjusted) – March 2026 | ||
|---|---|---|
| Region | Standardised Average Price £ | Annual Change % |
| East Midlands | 333,455 | -0.6 |
| Eastern England | 246,636 | 0.5 |
| Greater London | 536,751 | -1.2 |
| North East | 184,119 | 5.0 |
| North West | 247,442 | 3.1 |
| Northern Ireland | 224,809 | 8.7 |
| Scotland | 222,716 | 4.4 |
| South East | 383,573 | -1.9 |
| South West | 301,859 | -0.6 |
| Wales | 230,909 | 1.6 |
| West Midlands | 265,126 | 1.7 |
| Yorkshire and Humber | 217,704 | 1.2 |
| Source: Halifax | ||
Halifax reported a continuing divide between stronger growth in parts of the North and weaker conditions across southern England.
Northern Ireland recorded the highest annual increase, with average prices up 8.7% over the year to £224,809. Scotland rose 4.4% to £222,716, while Wales posted annual growth of 1.6%, taking the typical value to £230,909.
In England, Halifax said gains remained more concentrated in northern regions. The North East increased by 5% over the year to £184,119, and the North West rose 3.1% to £247,442.
In contrast, Halifax reported year-on-year falls in the South East, down 1.9% to £383,573, and in London, down 1.2% to £536,751.
Want to be regularly updated with mortgage news and features? Get exclusive interviews, breaking news, and industry events in your inbox – subscribe to our FREE daily newsletter. You can also follow us on Facebook, X (formerly Twitter), and LinkedIn.